PRESS RELEASE – Today (Friday, January 23, 2015), the Pennsylvania Department of Labor & Industry released its employment situation report for December 2014.
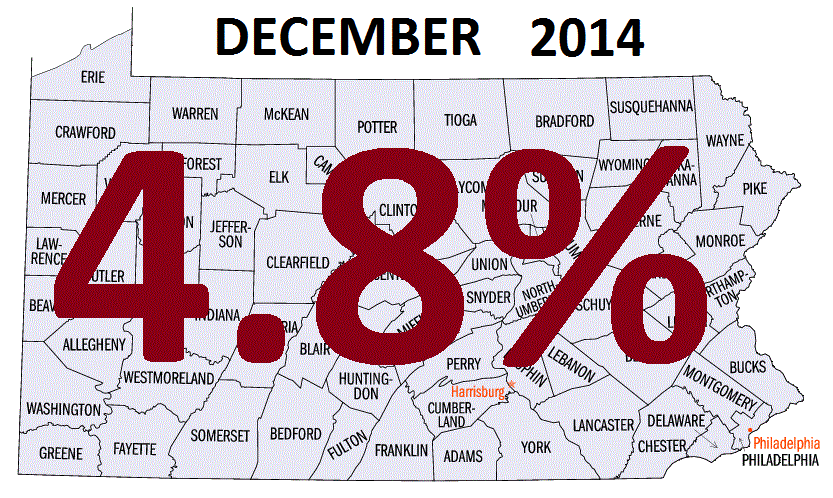
Pennsylvania’s unemployment rate declined by three-tenths of a percentage point in December to 4.8 percent, the commonwealth’s lowest rate since March 2008. This was the fourth consecutive monthly decline in the state unemployment rate and the ninth decline in 2014. Pennsylvania’s rate was eight-tenths of a percentage point below the U.S. rate of 5.6 percent. The commonwealth’s rate was down by 2.0 percentage points from last December while the national rate declined by 1.1 points over the year.Pennsylvania’s civilian labor force contracted slightly in December, down 1,000 to 6,367,000. Resident employment was up 13,000 while unemployment was down 14,000.
Total nonfarm jobs were up by 8,300 to 5,812,300, the highest level since June 2008. Private sector jobs rose 8,300 to a record high of 5,098,200. Within industries, the largest increase in December was 4,700 in education & health services. Construction had the largest decline, down 4,800.
Over the year, total nonfarm jobs in Pennsylvania were up 54,200 (+0.9%). The growth was almost entirely within private industries, with the largest gains in trade, transportation & utilities, education & health services and construction. Only two of the eleven supersectors declined from last December – information and government.
Note: The above data are seasonally adjusted. Seasonally adjusted data provide the most valid month-to-month comparison.
A breakdown of Pennsylvania’s employment statistics follows:
|
December
2014 |
November
2014 |
December
2013 |
Change from
November 2014 |
Change from
December 2013 |
|||
|---|---|---|---|---|---|---|---|
|
volume
|
percent
|
volume
|
percent
|
||||
|
PA
|
|||||||
|
Civilian Labor Force
|
6,367
|
6,368
|
6,424
|
-1
|
0.0%
|
-57
|
-0.9%
|
|
Employment
|
6,058
|
6,045
|
5,990
|
13
|
0.2%
|
68
|
1.1%
|
|
Unemployment
|
309
|
323
|
434
|
-14
|
-4.3%
|
-125
|
-28.8%
|
|
Rate
|
4.8
|
5.1
|
6.8
|
-0.3
|
—-
|
-2.0
|
—-
|
|
U.S.
|
|||||||
|
Civilian Labor Force
|
156,129
|
156,402
|
155,047
|
-273
|
-0.2%
|
1,082
|
0.7%
|
|
Employment
|
147,442
|
147,331
|
144,671
|
111
|
0.1%
|
2,771
|
1.9%
|
|
Unemployment
|
8,688
|
9,071
|
10,376
|
-383
|
-4.2%
|
-1,688
|
-16.3%
|
|
Rate
|
5.6
|
5.8
|
6.7
|
-0.2
|
—-
|
-1.1
|
—-
|
|
December
2014 |
November
2014 |
December
2013 |
Change from
November 2014 |
Change from
December 2013 |
|||
|---|---|---|---|---|---|---|---|
|
volume
|
percent
|
volume
|
percent
|
||||
|
Total Nonfarm Jobs
|
5,812.3
|
5,804.0
|
5,758.1
|
8.3
|
0.1%
|
54.2
|
0.9%
|
|
Goods Producing Industries
|
834.3
|
837.2
|
820.3
|
-2.9
|
-0.3%
|
14.0
|
1.7%
|
|
Mining & Logging
|
37.9
|
38.0
|
36.5
|
-0.1
|
-0.3%
|
1.4
|
3.8%
|
|
Construction
|
231.2
|
236.0
|
222.4
|
-4.8
|
-2.0%
|
8.8
|
4.0%
|
| Manufacturing |
565.2
|
563.2
|
561.4
|
2.0
|
0.4%
|
3.8
|
0.7%
|
| Service Providing Industries |
4,978.0
|
4,966.8
|
4,937.8
|
11.2
|
0.2%
|
40.2
|
0.8%
|
|
Trade, Transportation & Utilities
|
1,124.1
|
1,120.8
|
1,110.1
|
3.3
|
0.3%
|
14.0
|
1.3%
|
|
Information
|
86.6
|
86.4
|
87.7
|
0.2
|
0.2%
|
-1.1
|
-1.3%
|
|
Financial Activities
|
314.2
|
313.4
|
312.3
|
0.8
|
0.3%
|
1.9
|
0.6%
|
|
Professional & Business Services
|
758.7
|
760.7
|
755.2
|
-2.0
|
-0.3%
|
3.5
|
0.5%
|
| Education & Health Services |
1,171.2
|
1,166.5
|
1,159.4
|
4.7
|
0.4%
|
11.8
|
1.0%
|
| Leisure & Hospitality |
549.8
|
546.4
|
542.2
|
3.4
|
0.6%
|
7.6
|
1.4%
|
| Other Services |
259.3
|
258.5
|
253.4
|
0.8
|
0.3%
|
5.9
|
2.3%
|
| Government |
714.1
|
714.1
|
717.5
|
0.0
|
0.0%
|
-3.4
|
-0.5%
|
For a more detailed breakdown of seasonally adjusted jobs data at the sector level, please contact the Center for Workforce Information & Analysis at 1-877-4WF-DATA, or visit http://www.paworkstats.pa.gov/.
–
Above information/charts source: http://www.paworkforce.state.pa.us/portal/server.pt/gateway/PTARGS_0_2_126740_12865_701805_43/http%3B/pubcontent.state.pa.us/publishedcontent/publish/cop_hhs/dli/_l_i_enterprise_news___media/media_portlets/newsitems/pa_unemployment_rate_down_in_december_to_4_8_.html
–
–
More information from June 2014 to November 2014 can be found on the United States Department of Labor – Bureau of Labor and Statistics website at http://www.bls.gov/eag/eag.pa.htm.
Click HERE to view information for the past ten years (with the option to research as far back as 1976).
The lowest recorded Pennsylvania unemployment rate since 1976 was January to April in 2007 with a rate of 4.2%.
The highest recorded Pennsylvania unemployment rate since 1976 was January to March in 1983 with a rate of 12.9%.
